May 24, 2026
Bazel Remote Cache on GitHub Actions: Why Ephemeral Runners Hurt You and How to Fix It
Every GitHub Actions job starts with an empty disk cache, forcing Bazel onto high-latency network calls. Learn why ephemeral runners hurt your build times and how to resolve it with persistent Cache Volumes.
TL;DR
- Every GitHub-hosted job starts with an empty disk cache, forcing Bazel to fall through to the remote cache for all 5,000+ actions in your graph. The runner discards everything Bazel cached the moment the job ends, so your carefully configured
--disk_cacheflag is set but contributing nothing. - 80% hit rate on 5,000 actions still means 4,000 AC lookups over the network, and at 50ms per lookup cross-region, that's minutes of overhead before a single byte of output is fetched.
- Rust and C++ monorepos blow past GitHub's 10GB default cache limit within days, tar/untar on a 2-core runner is slower than the network transfer it's replacing, and PR builds miss the cache entirely because the key was written on
main. - The hot tier is NVMe storage physically co-located with the runner, so AC lookups that hit it behave at sub-millisecond disk speed rather than 50ms network speed. The volume persists across job teardown via a fork-on-commit model, meaning run 2 onwards reads from a warm local cache before touching the network at all.
- When committed cache content exceeds the configured volume size, the next run receives a completely empty volume with no error in CI logs, no Bazel warning, nothing. Builds suddenly return to full cold-start times and the first instinct is always a Bazel configuration regression.
- 800 uncached Rust compile actions at 3 seconds each take 300 seconds on an 8-vCPU runner and 75 seconds on a 32-vCPU runner, a 4x difference that no cache tuning recovers. For JVM and Python workloads the bottleneck shifts to RAM, where Bazel's server process, test JVMs, and the repository cache compete for the same memory pool, making a memory-heavy shape outperform a CPU-heavy one on the same action count.
What Nobody Tells You About Bazel Remote Cache on CI
Engineers adopted Bazel because it promised incremental builds, fine-grained caching, and CI times that scale with change size rather than codebase size. But in reality, a GitHub blog experiment showed that a developer waiting on a one-hour build costs a business roughly $75 in lost time per run, and that number compounds fast on active monorepos with multiple engineers pushing throughout the day. Meanwhile, Atlassian's 2025 developer experience survey found that developers spend only 16% of their time coding, with CI wait time and tooling friction accounting for a significant share of the rest. Bazel was supposed to shrink that wait. For many teams, it hasn't, and the reason isn't Bazel.
The reason is the infrastructure Bazel runs on. Standard GitHub-hosted runners are ephemeral: every job starts from a blank slate, every job throws away whatever Bazel cached during the run, and every job depends entirely on a remote cache sitting behind a network round-trip. When teams set up --remote_cache pointing at a GCS or S3 bucket, see "remote cache enabled" in the logs, and still watch 15-minute pipelines, the diagnosis usually stops at "Bazel must be misconfigured."
In this end to end article we cover how Bazel's two-layer caching model works, why ephemeral runners structurally undermine the local cache layer, where latency actually accumulates in a remote-cache-only setup, and how Namespace's persistent NVMe-backed cache volumes solve the problem at the infrastructure level rather than the configuration level. Along the way, it covers the full setup, .bazelrc tuning, cache volume sizing, machine shape selection, and how to diagnose when something still isn't working.
How Bazel's Caching Model Works
Most engineers who've configured --remote_cache have a working mental model of "Bazel checks the cache, if the output exists it skips the build, if not it rebuilds." That model is close enough to not be obviously wrong, but it misses two things that explain why high cache hit rates still produce slow builds. Understanding the actual two-layer design makes both the problem and the fix obvious.
Action Cache vs. Content Addressable Storage
Start with a concrete BUILD file:
genrule(
    name = "compile_server",
    srcs = ["server.cc"],
    outs = ["server.o"],
    cmd = "gcc -c $< -o $@",
)

genrule(
    name = "link_binary",
    srcs = [":compile_server", "main.o"],
    outs = ["server_bin"],
    cmd = "gcc $^ -o $@",
)
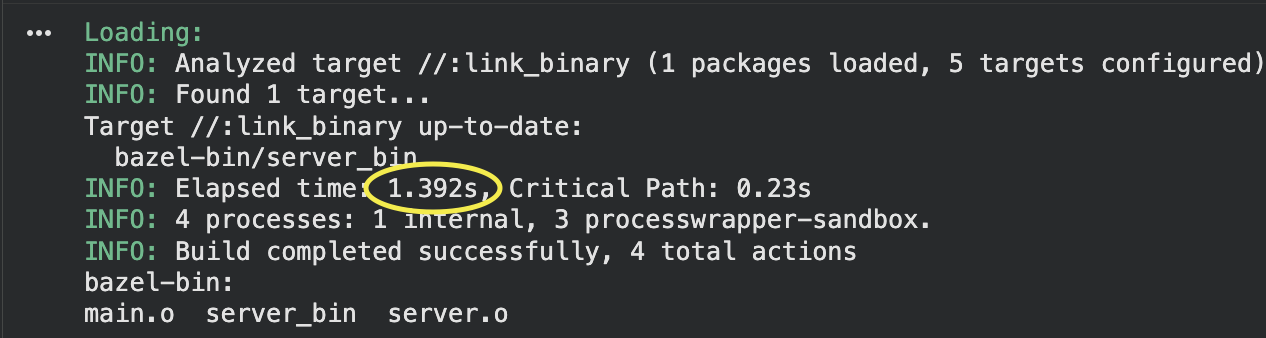
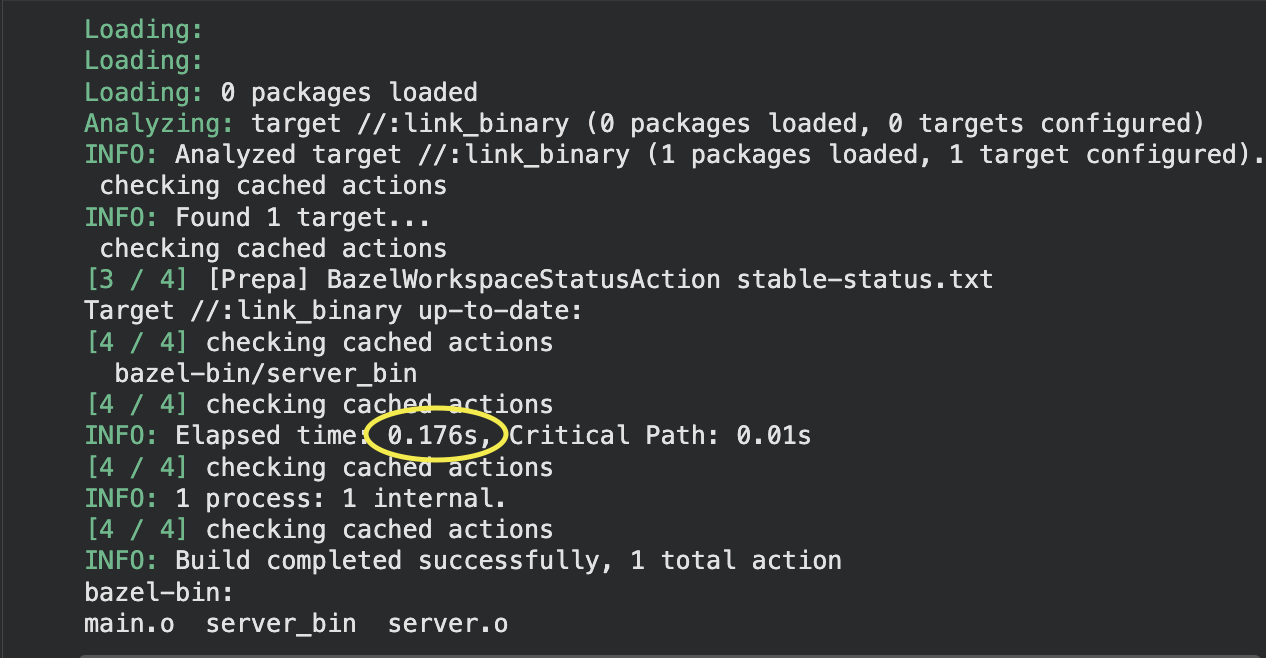
Run bazel build //:link_binary on a fresh machine. Bazel executes both actions, produces server.o and server_bin, and stores the results. Now run bazel build //:link_binary again immediately. The second run completes in milliseconds because Bazel's in-memory state still knows what it just built.
Now run bazel shutdown to kill the Bazel server process, then run bazel build //:link_binary a third time. The output files still exist on disk. Bazel rebuilds nothing, but the run takes noticeably longer than the second run. Why?
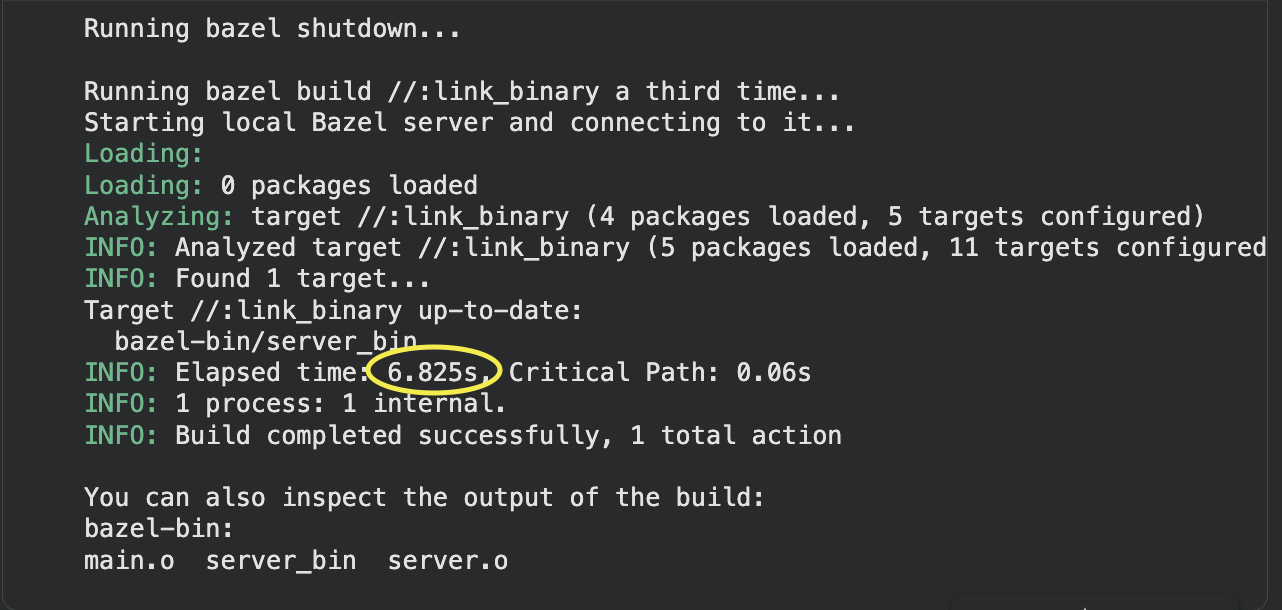
With the in-memory state gone, Bazel can't just say "I already built this." It has to consult the Action Cache (AC), an on-disk persistent store that maps action keys to action results. An action key is a hash of everything that defines the action: the input files' content digests, the command string, and the environment variables whitelisted via --action_env. The action result records the exit code and, critically, a mapping of output file names to output file content digests.
Armed with the AC result, Bazel checks whether server.o and server_bin exist on disk and re-computes their digests. If the on-disk digests match what the AC recorded, Bazel declares the actions up to date and skips re-execution. The slowdown on the third run is entirely the cost of re-digesting the input and output files from disk, the "checking cached actions" pause you've probably seen in Bazel's output.
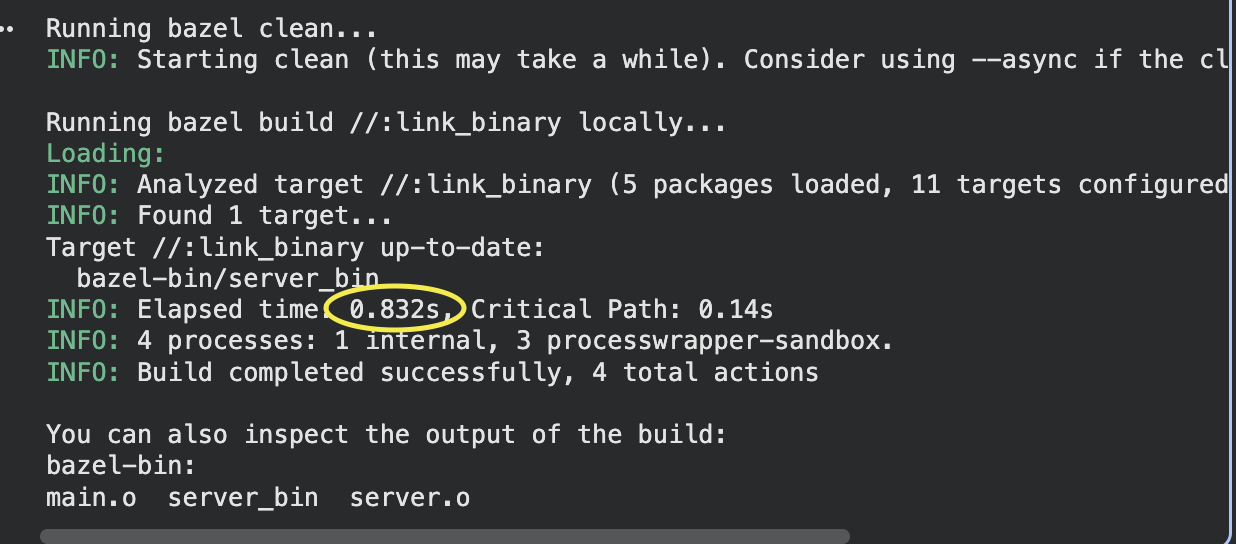
Now introduce a remote cache and run bazel clean between builds. bazel clean wipes both the local AC and the output tree. When Bazel runs again, it queries the remote AC: "given this action key for compile_server, do you know the result?" The remote AC says yes and returns the same name-to-digest mapping. But server.o no longer exists on disk. Bazel can't verify the digest against a local file, so how does it get the file?
That's what the Content Addressable Storage (CAS) is for. The CAS is the second layer of the remote cache. It maps file content digests to file contents, nothing else. No filenames, no action associations, just: "here's a SHA256 hash, give me the bytes that hash to it." When the remote AC tells Bazel that server.o should have digest a3f7..., Bazel fetches a3f7... from the CAS and writes the bytes to the local output path.
A cache hit on the remote cache is therefore a two-step operation for every output file. The AC lookup answers "what should the outputs look like?" The CAS fetch answers "here are the actual bytes." Both have to succeed. If the AC has the result but the CAS has evicted the blob (common on caches with aggressive eviction policies), Bazel re-executes the action from scratch.
One practical consequence is that a corrupted action key at the AC layer causes a miss regardless of what's in the CAS. If server.cc gets a timestamp embedded in a generated header it includes, the input digest changes on every run, the action key changes, and the AC lookup finds nothing, even though the exact same server.o blob is sitting in the CAS waiting to be fetched.
Every environment variable that changes between runs and leaks into the action definition, every tool invoked from an unversioned path like /usr/bin/gcc where the version varies by machine, every genrule that embeds $(date) in an output: all of them produce action keys that change run to run and generate AC misses regardless of cache population.
Disk Cache vs. Remote Cache
Bazel supports --disk_cache and --remote_cache simultaneously. Both implement the same AC + CAS protocol; the difference is purely latency and persistence.
--disk_cache points at a local directory. Reads and writes happen at NVMe or SSD speed, typically sub-millisecond per operation. The cache only exists on the current machine. When the runner is discarded, the disk cache is gone.
--remote_cache points at an HTTP or gRPC endpoint. Reads and writes cross a network. On a GCS or S3 bucket in a different region from your CI runner, each individual AC lookup carries 20–100ms of round-trip latency.
Here’s the reality: take a monorepo with 5,000 Bazel actions. Run it with an 80% remote cache hit rate (a genuinely good number). That's 4,000 remote AC lookups per build.
Bazel issues many in parallel, so the wall-clock cost isn't 4,000 × 50ms. But on a 16-vCPU runner issuing 32 parallel requests, the effective cost is still 4,000 ÷ 32 × 50ms = roughly 6 seconds just for AC lookups, before a single CAS fetch happens. Add CAS fetches for every hit (one fetch per cached output file, and a compiled C++ object is one file per source), and the overhead climbs further.
The disk cache eliminates this overhead for everything it holds. A --disk_cache lookup is roughly 0.5ms. The same 4,000 lookups at 0.5ms each cost 2 seconds total even without any parallelism, and with parallelism they cost almost nothing. Bazel always checks the disk cache before the remote cache, so a warm disk cache means the remote cache is only consulted for the small fraction of actions that are missed locally.
Where Most Teams Go Wrong
Teams configure --remote_cache pointing at a GCS bucket, watch the CI logs print INFO: 3,842 processes: 3,074 remote cache hits, and conclude the setup is working. The cache hit rate looks fine. The builds still take 14 minutes instead of 4.
The hit rate only measures how often Bazel skipped re-execution. It says nothing about how long the AC lookups and CAS fetches took. An 80% hit rate on 5,000 actions with a high-latency remote cache can easily cost 3–5 minutes of overhead per build, overhead that doesn't appear in any single obvious metric, just in the wall-clock time between "starting analysis" and "build complete."
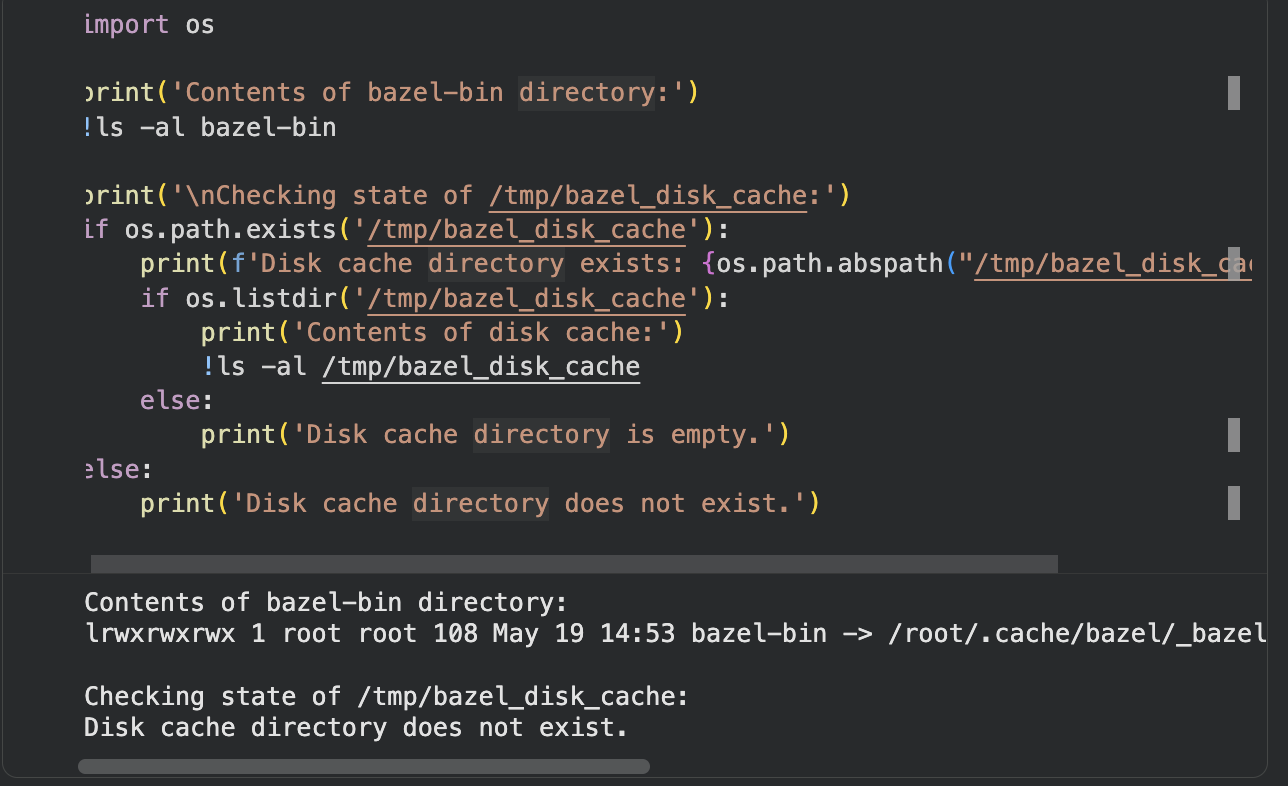
The second error is assuming --disk_cache is contributing when configured on an ephemeral runner. The flag is set. The directory path exists. But on every fresh GitHub-hosted runner, the directory is empty. Bazel checks it, misses every action, and falls through to the remote cache for the full build. There is no warm local layer absorbing lookups at disk speed. Every single one of the 5,000 actions goes over the network, even the ones whose outputs haven't changed in six months.
To see this clearly, look at what --disk_cache and --remote_cache actually do together in sequence:
- Bazel computes the action key for
compile_server. - Bazel checks
--disk_cache: empty, miss. - Bazel checks
--remote_cache(AC): hit, returns digesta3f7...forserver.o. - Bazel checks
--disk_cacheagain for the bloba3f7...: empty, miss. - Bazel fetches blob
a3f7...from--remote_cache(CAS): returns bytes, writes to disk. - Repeat steps 1–5 for every single action in the graph.
On a runner with a warm disk cache, steps 2 and 4 both return hits and steps 3 and 5 never execute. On an ephemeral runner, steps 2 and 4 are wasted disk checks that add up to nothing, and the entire load falls on the network. The build is as slow as if --disk_cache weren't configured at all, because for practical purposes on an ephemeral runner, it isn't.
Why Ephemeral Runners Break Bazel's Local Cache Layer
The structural problem with GitHub-hosted runners is the lifecycle and not the hardware. Understanding exactly where the local cache layer fails explains why remote-cache-only setups always leave time on the table.
What Happens to --disk_cache on GitHub-Hosted Runners
Every GitHub Actions job on a hosted runner starts from a freshly provisioned VM. The disk is empty. The Bazel output base is empty. Any --disk_cache path you've configured holds nothing. When a job completes, the VM is discarded entirely.
For a monorepo with 10,000 Bazel actions, a warm disk cache means Bazel checks the cache, gets hits on unchanged actions in milliseconds, and only re-executes the targets affected by the actual code change. Starting cold means every action is a miss. Bazel falls through to the remote cache for every single lookup, downloading all unchanged artifacts from across the network rather than reading them from local disk.
The analysis cache compounds the problem further. Bazel keeps its dependency graph and target analysis in memory in the Bazel server process. On a cold run, Bazel re-analyzes the entire build graph from scratch. For large monorepos, analysis alone can add 15–90 seconds depending on monorepo size.
The step-by-step trace below shows exactly where each lookup goes on an ephemeral runner, and what changes with a persistent Cache Volume.
Why actions/cache Doesn't Fully Solve It
Engineers who've tried this know it works in theory and disappoints in reality. The restore step serializes to a single network download before the job can proceed, adding 2-4 minutes for large Bazel caches. Tar/untar of a multi-gigabyte cache directory is CPU-bound and slow on standard 2-core runners. Cache keys typically include branch names or workflow identifiers, which means PRs miss the cache entirely if the key was written on the main branch. And GitHub's cache eviction policy enforces a 10GB per-repo limit per repository, which is insufficient for Rust or C++ monorepos that accumulate gigabytes of compiled artifacts per week.
Even when restore works, it restores a stale snapshot. Bazel still re-analyzes the graph to check which cached outputs are valid for the current inputs. The saved time is real but bounded.
The Compound Problem
No persistent disk cache means every run starts cold and hits the remote cache for every action. High remote cache latency means even those hits are slow. A team that adopted Bazel to get 5-minute CI runs on incremental changes gets 12–18 minute pipelines instead, not because the build system is misconfigured, but because the runner discards everything Bazel cached the moment the job ends.
Where Namespace Changes the Equation
Namespace addresses the ephemeral runner problem not by patching around it with restore scripts, but by replacing the storage layer entirely. The architecture is worth understanding before looking at the configuration, because it explains why the improvement isn't marginal.
The Tiered Cache Architecture
Namespace's Bazel cache uses a two-tier design. The hot tier is backed by local NVMe storage physically co-located with the runner. The cold tier is backed by Namespace's artifact storage, a globally distributed, high-throughput object store.
When Bazel queries the remote cache, the hot tier responds first. NVMe latency sits in the sub-millisecond range. For a build with 5,000 actions, the difference between 50ms per lookup (GCS cross-region) and 1ms per lookup (NVMe co-located) is the difference between minutes of overhead and seconds. Frequently accessed blobs stay warm in the hot tier automatically, promoted from the cold tier without any configuration.
The widget below shows the per-action request flow through both tiers, the fork lifecycle across runs, and a sizing calculator for Cache Volumes — open each tab as you read the sections below.
Cache Volumes: Persistent NVMe Storage That Survives Across Runs
Cache Volumes are Namespace's solution to the ephemeral runner problem. Unlike the runner's ephemeral disk, a Cache Volume persists between job invocations. When Bazel's --disk_cache points at a mounted Cache Volume, the local cache survives job teardown. The first run populates it. Every subsequent run reads from it at disk speed before going to the remote cache at all.
 Private caching loop with persistent local cache mounts.
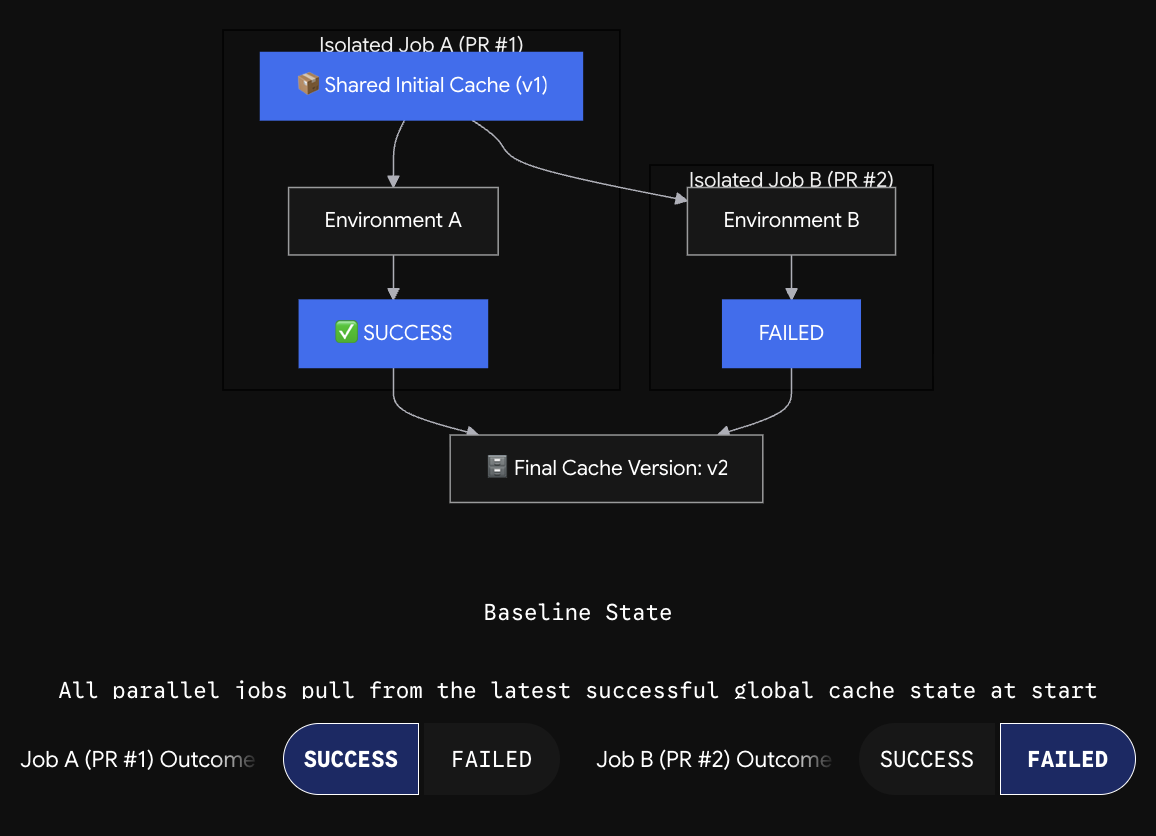
When a job requests a Cache Volume, Namespace creates a fork of the most recent committed cache state. Each job instance gets its own private copy of that fork. When the job completes successfully (exit code 0), its cache state becomes the new committed version. Failed jobs have their cache changes discarded automatically. Parallel jobs running simultaneously each get their own fork of the last committed version, so concurrent builds don't corrupt each other's cache state.
The one operational risk worth flagging: when committed cache content exceeds the configured volume size, the next run receives an empty volume, resulting in a silent cold start with no error in CI logs. Always size your volumes generously to avoid this.
Local-to-CI Cache Sharing
Namespace grants cache access via short-lived credentials scoped to the workspace. When a developer runs nsc cache bazel setup locally, the CLI generates a bazelrc configuration pointing at the same cache backend CI uses. Pull a branch CI already built, run bazel build //..., and the first local build hits the cache rather than recompiling from scratch. With --remote_upload_local_results=true in your .bazelrc, local builds write back to the shared cache and CI can hit those entries too.
Cross-Job Cache Consistency
Multiple PRs building simultaneously each get forked copies of the last committed cache state. Writes from Job A don't affect Job B's view of the cache during the run. When both complete, the last one to commit wins. For most Bazel workflows, the model is safe because Bazel's content-addressed outputs are deterministic: two jobs building the same target with the same inputs produce identical outputs regardless of which commit wins.
Setting Up Namespace for Bazel: The Complete Configuration
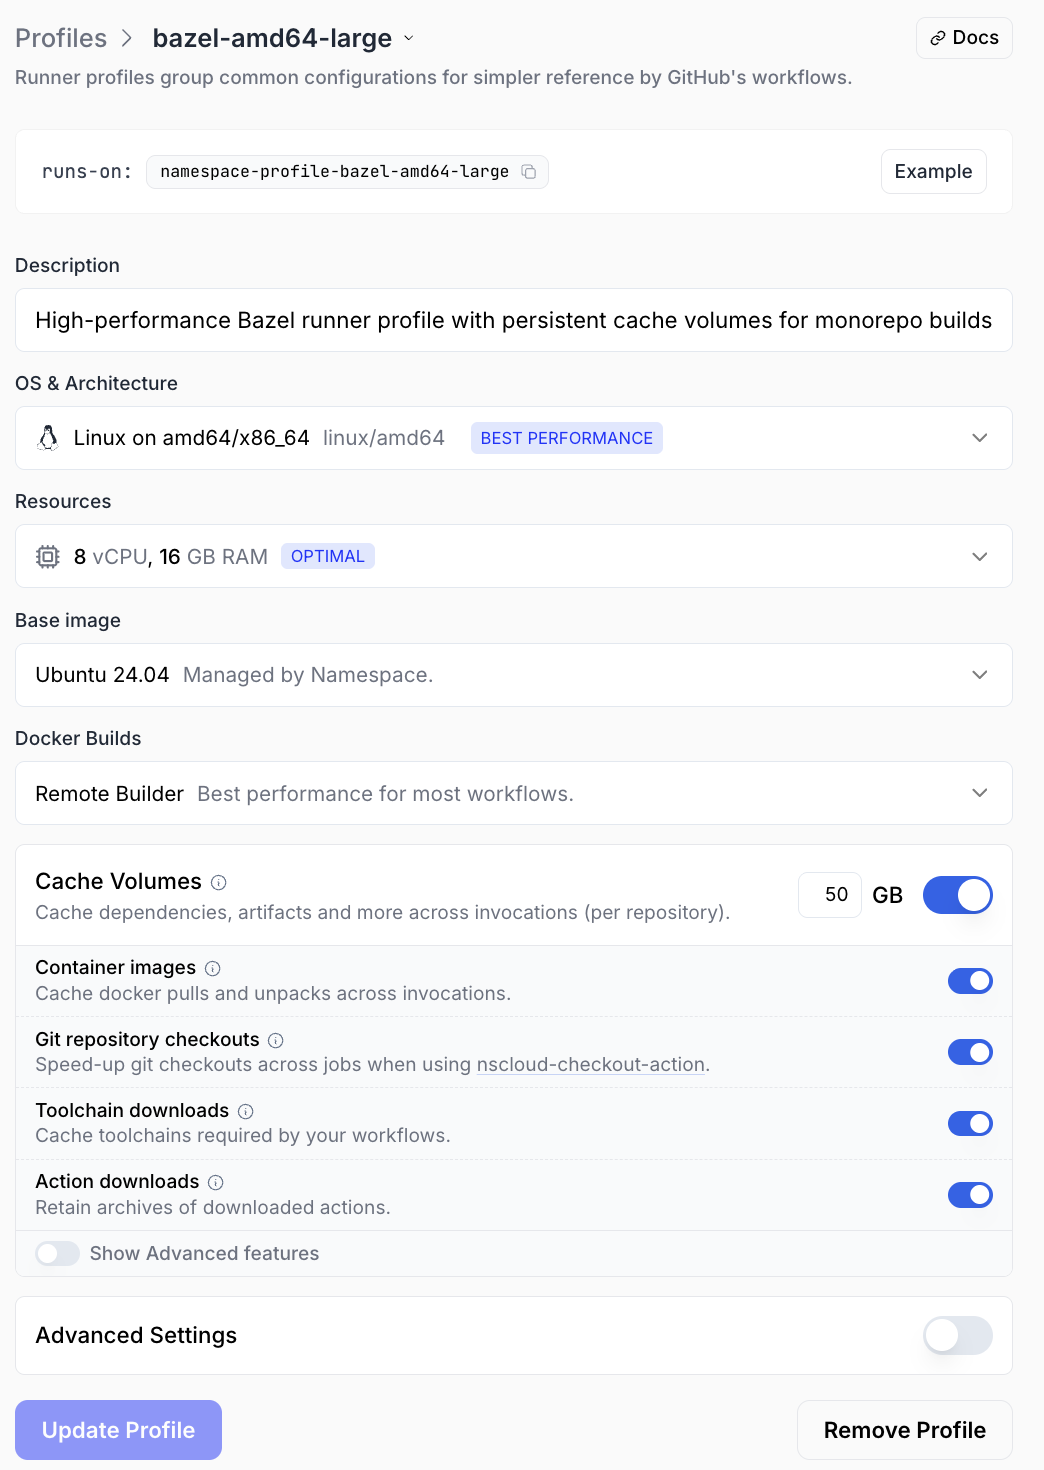
Create a Runner Profile with Bazel Caching Enabled
Namespace runner profiles are the configuration unit for GitHub Actions. A profile defines the machine shape, the OS, and which add-ons are enabled.
Note: Bazel caching is a paid add-on. Contact Namespace sales to enable it for your workspace before the profile toggle becomes available.
Steps:
- Open the Namespace dashboard and press New Profile.
- Give it a name. The name appears in your
runs-onlabel, e.g.,namespace-profile-bazel-build.
- Select the OS: Linux AMD64 for most Bazel workloads (or macOS ARM64 if you're building for Apple targets).
- Pick a machine shape (see the Machine Shape Selection guide below).
- Enable Bazel Cache in the profile configuration dialog.
- Press Create Profile.
Once the profile has Bazel cache enabled, the nsc cache bazel setup command runs automatically during runner initialization, configuring /etc/bazel.bazelrc with short-lived credentials and the correct remote cache endpoint.
The Minimal Working Workflow
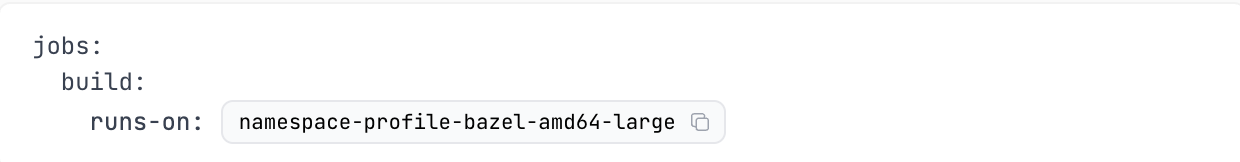
With a profile that has Bazel caching enabled, the workflow file is extremely simple:
jobs:
  build:
    runs-on: namespace-profile-bazel-amd64-large
    steps:
      - uses: actions/checkout@v4
      - name: Build and test
        run: bazel test //...
No cache restore steps. No credential setup. No actions/cache configuration. Bazel is already pointed at the Namespace cache backend because /etc/bazel.bazelrc was written during runner startup.
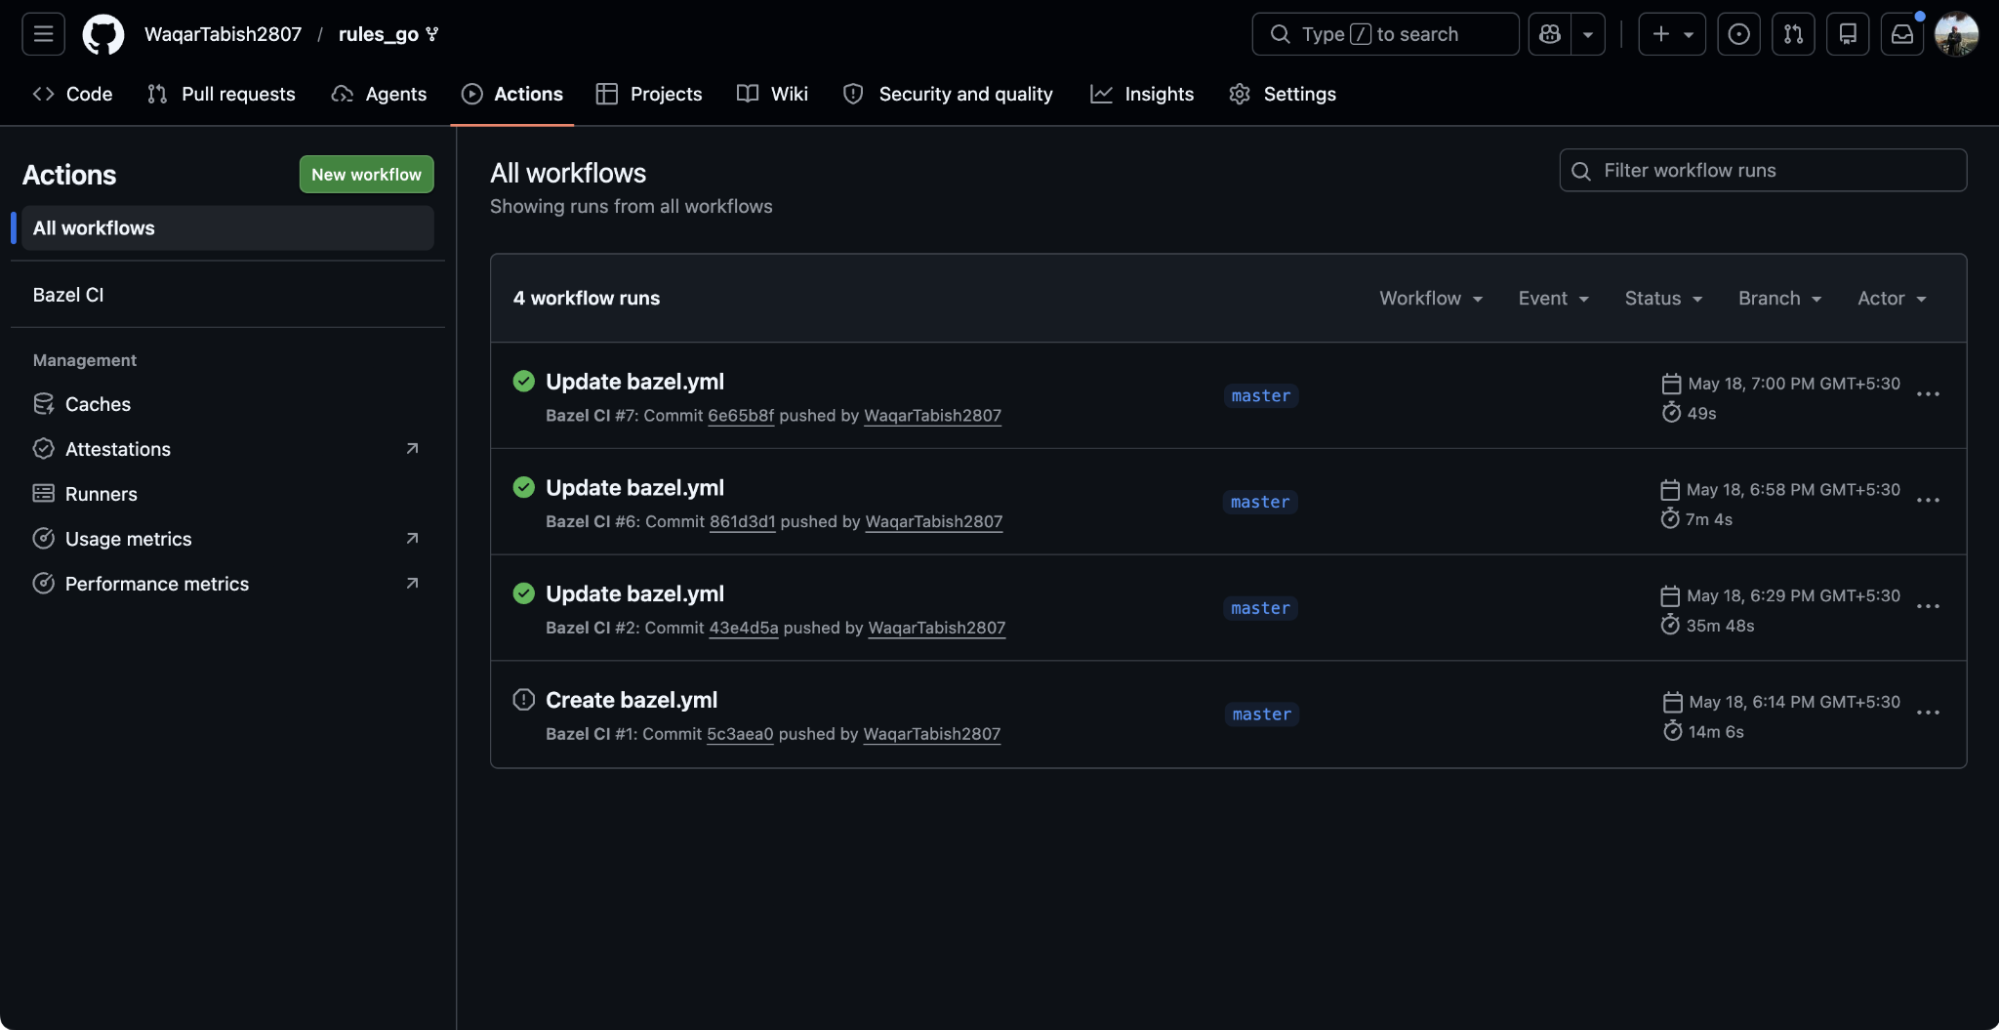 GitHub Actions workflow UI recognizing the Namespace runner.
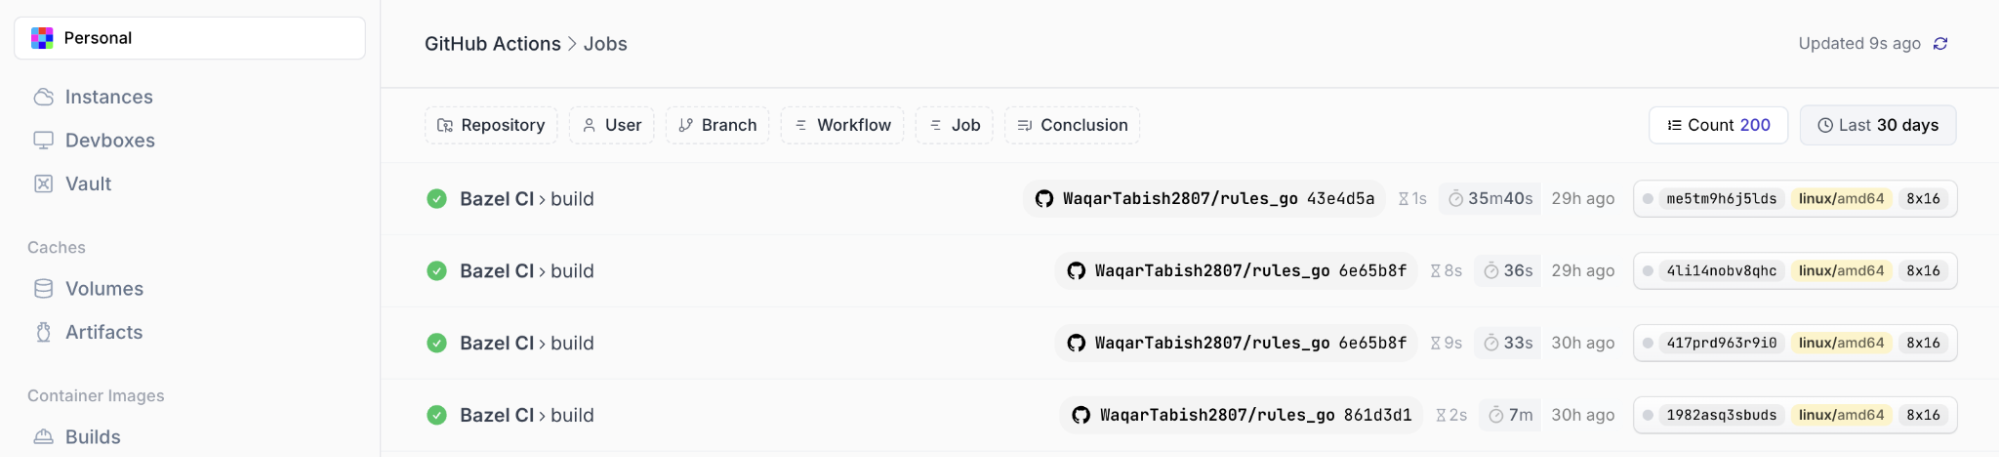 Execution metrics showing high-throughput caching hits.
Manual Setup with nsc cache bazel setup
For teams not using GitHub Actions, or using a custom runner profile where automatic setup isn't triggered, run the CLI command directly:
nsc cache bazel setup --bazelrc /etc/bazel.bazelrc
The command generates short-lived credentials and writes a bazelrc configuration file to the specified path. To combine it with your existing project .bazelrc:
nsc cache bazel setup --bazelrc /etc/bazel.bazelrc
bazel --bazelrc=/etc/bazel.bazelrc --bazelrc=.bazelrc test //...
Bazel accepts multiple --bazelrc flags and merges them in order. The Namespace-generated file contains the remote cache endpoint and credentials. Your project file contains build flags, test configuration, and other project-specific settings.
Recommended .bazelrc Additions
Your project .bazelrc should add the following flags for best performance:
build --remote_upload_local_results=true
build --remote_timeout=60
build --jobs=HOST_CPUS*2
build --experimental_remote_cache_compression=true
--remote_upload_local_results=true: Without this flag, local builds don't write results back to the remote cache. With it, a developer's local build populates the shared cache that CI and other developers can hit.--remote_timeout=60: Sets the timeout for remote cache operations. The default is 60 seconds, which is fine for most setups, but teams on slow connections may want to increase it to avoid timeouts on large artifact uploads.--jobs=HOST_CPUS*2: Controls Bazel's parallelism.HOST_CPUSresolves to the number of available vCPUs on the runner at runtime.--experimental_remote_cache_compression=true: Enables zstd compression for cache transfers. Reduces bandwidth consumption on large artifact uploads and downloads. Note: Use--experimental_remote_cache_compression=trueon Bazel 6.x; on Bazel 7+ the flag is--remote_cache_compression=true
Cache Volume Sizing for Bazel
To size correctly, estimate your action graph's output footprint:
# Count target outputs in the action graph
bazel query '//...' | wc -l
For more precision, run a full build locally and check the size of the Bazel output directory:
du -sh $(bazel info output_path)
General starting points by codebase type:
| Codebase Type | Suggested Starting Size | Notes |
|---|---|---|
| Go monorepo | 20–30 GB | Compiled outputs are compact |
| JVM (Java/Kotlin/Scala) | 30–50 GB | JARs accumulate fast on large graphs |
| Python | 10–20 GB | Usually not the bottleneck |
| Rust monorepo | 80–150 GB | Compiled artifacts are large; rlib files add up quickly |
| C++ monorepo | 60–120 GB | Object files and static libraries are large |
| Mixed (Go + Rust) | 100–200 GB | Size for the heaviest language in the graph |
For an active Rust monorepo with 20+ engineers pushing daily, a 50GB volume fills within days. Start with at least 100GB and monitor via the Namespace Usage Explorer.
Diagnosing Cache Performance
A working Namespace Bazel setup should show specific patterns in both Bazel's own output and in the Namespace dashboard.
Reading Bazel's Cache Stats Output
Every bazel build or bazel test run prints a summary line:
INFO: 3,842 processes: 2,891 remote cache hit, 847 linux-sandbox, 104 internal.
On a warm cache with a small code change, remote cache hit should account for 85–95% of processes. A ratio below 60% on a change that touches less than 5% of the build graph usually indicates a hermeticity problem.
Namespace Usage Explorer for Cache Analysis
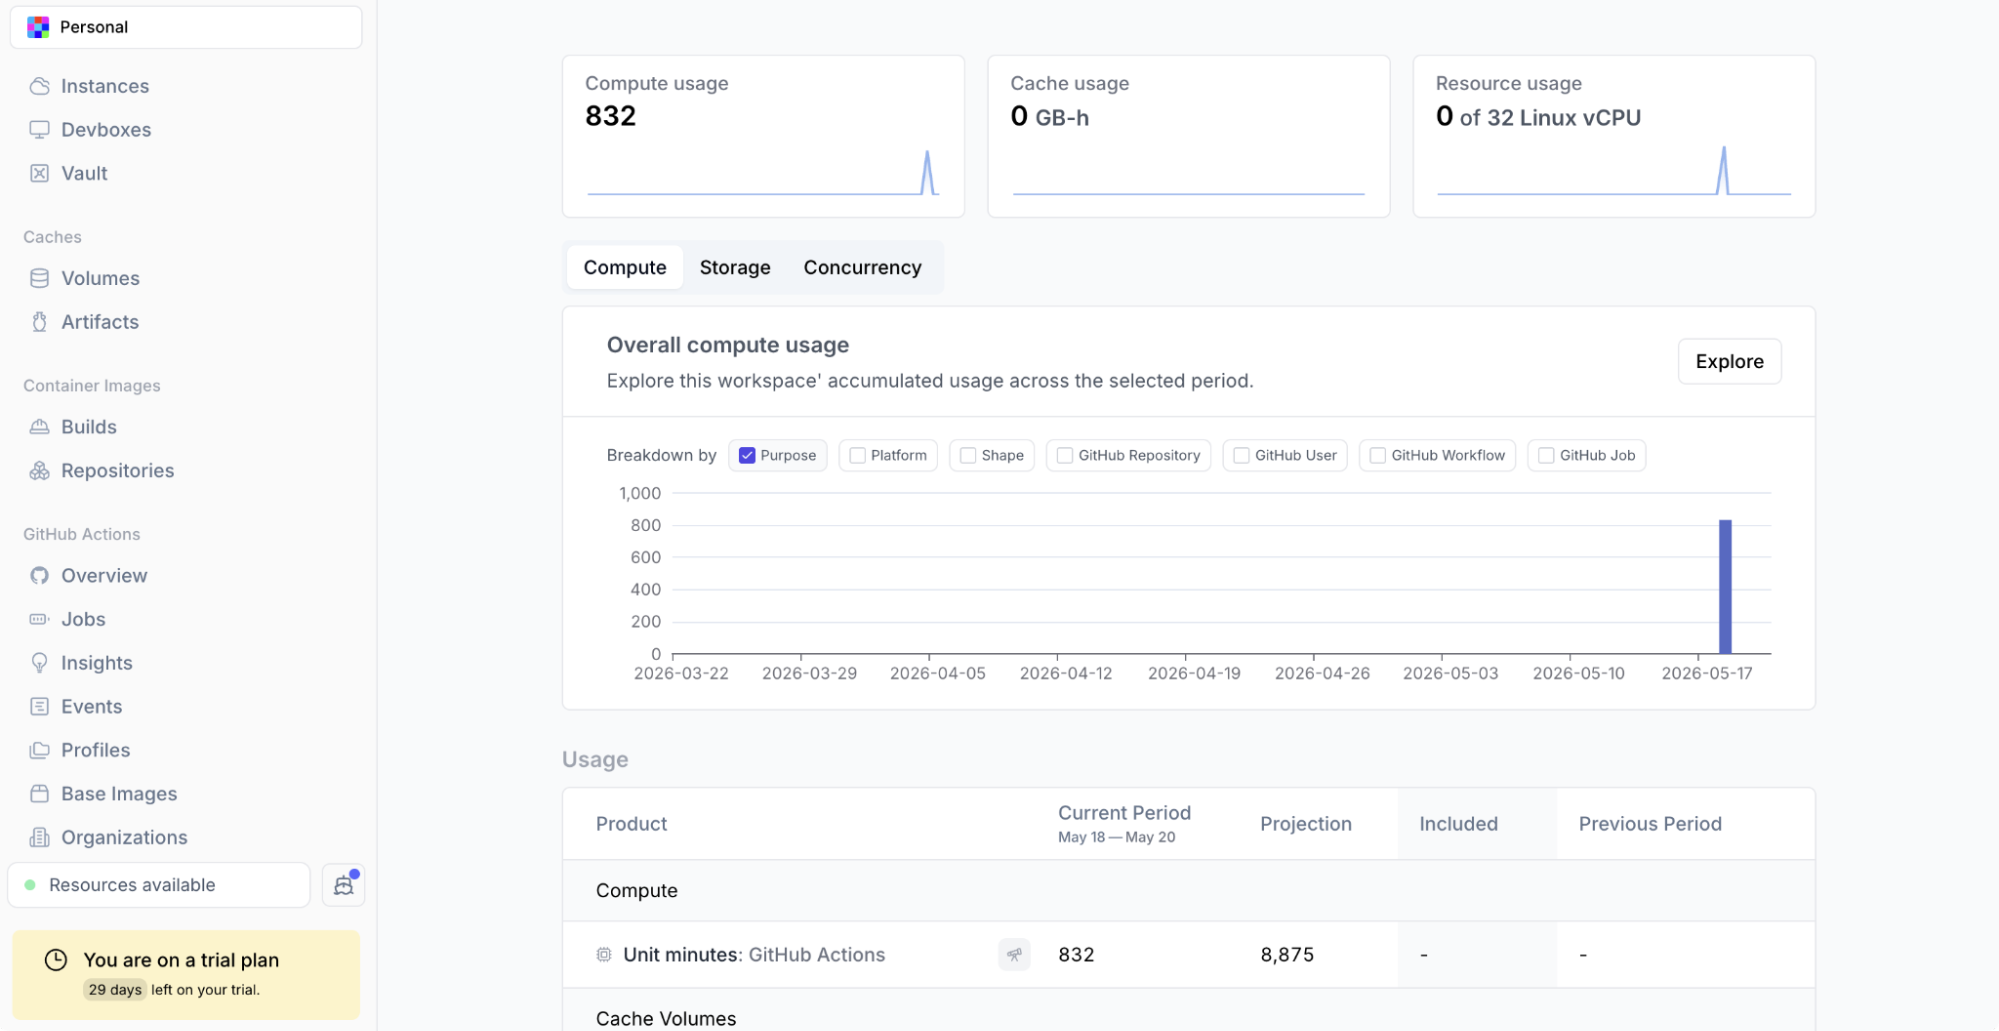 Namespace Usage Explorer dashboard showing cache activity.
The Usage Explorer in the Namespace dashboard shows cache storage consumed, cache read events, and GB-hours. Correlating cache read volume with CI run times confirms the cache is being used.
Common Failure Modes and How to Diagnose Them
Cache misses on every run despite a warm cache: Almost always a hermeticity issue. Use --explain to identify what's invalidating actions:
bazel build //... --explain=/tmp/bazel-explain.txt
cat /tmp/bazel-explain.txt | grep -i "not reused"
High cache hit rate but builds still slow: First, --jobs is too low to saturate cache read throughput. Second, the hot NVMe tier may not be warm yet on the first run after a cache volume commit.
Cache volume size exceeded (silent cold cache): Symptoms are a sudden return to cold build times with no configuration changes. Confirm by checking the storage dashboard for the volume's current state. Release the stale volume if needed:
nsc volume release <volume-tag>
Then update the profile's configured volume size before the next run.
Machine Shape Selection for Bazel Workloads
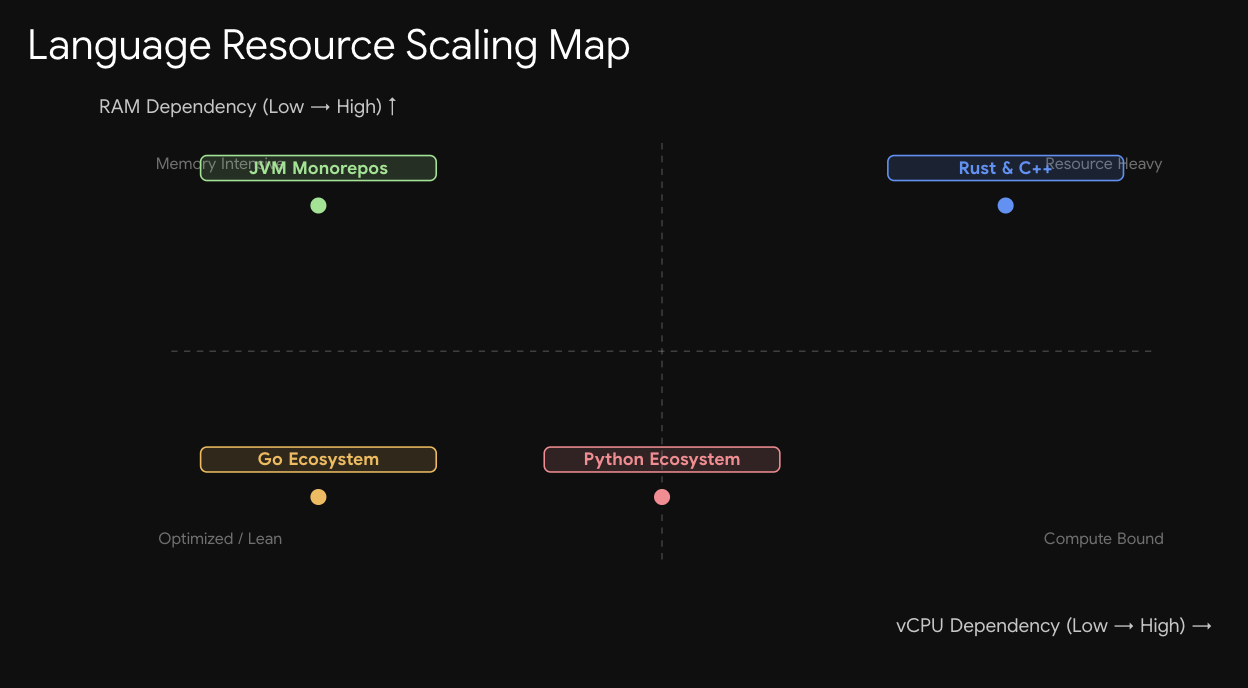 CPU and RAM resource profiles for diverse build sizes.
1. CPU-Bound Workloads (Rust, C++)
Compilation dominates wall-clock time. Shapes with more vCPUs directly reduce the critical path. Consider a practical example: 2,000 uncached Rust compile actions at 3 seconds each, with a 60% cache hit rate, leaves 800 actions to execute locally.
- With
--jobs=8on an 8x16 shape: 800 actions ÷ 8 parallel jobs = ~300 seconds execution time. - With
--jobs=32on a 32x64 shape: 800 actions ÷ 32 parallel jobs = ~75 seconds execution time.
For Rust and C++ monorepos, 16x32 or 32x64 shapes pay for themselves quickly in reduced wall-clock time. Use --jobs=HOST_CPUS*1.5 rather than *2 to avoid memory pressure from too many concurrent linker processes.
2. I/O-Bound Workloads (JVM, Python)
JVM compilation is faster per action, but test execution saturates memory rather than CPU. Bazel's JVM process, the test JVMs, and the repository cache all compete for RAM. A 4x16 or 8x32 (non-standard memory-heavy shape) often outperforms an 8x16 on large Scala or Kotlin test suites. Namespace's machine shapes allow non-standard configurations where you can grow memory allocation independently of vCPU count.
When to Go Large vs. When to Split
For very large monorepos, splitting bazel test //... into parallel jobs on smaller shapes can be cheaper than a single large shape. The --target_pattern_file flag reads build targets from a file, making it straightforward to shard the build:
# Generate shards
bazel query '//...' | split -n l/4 - /tmp/shard_

# In CI, run each shard on a separate job
bazel test --target_pattern_file=/tmp/shard_aa
Requires GNU coreutils. On macOS, install via brew install coreutils or use gsplit.
What's Coming: Remote Execution on Namespace
Namespace has signaled that remote execution is next on the Bazel roadmap: "horizontally scale your Bazel builds through remote execution on Namespace compute." Early access is available by contacting Namespace support directly.
Remote execution is architecturally distinct from remote caching. With --remote_cache only, Bazel executes actions locally and reads/writes results to the remote cache. With --remote_executor, Bazel sends action execution to a fleet of remote workers, removing the per-runner CPU ceiling entirely. A build bottlenecked by 1,000 sequential Rust compile actions on a single runner can distribute across many remote workers in parallel.
Teams using Namespace for remote caching can adopt remote execution incrementally when it's available: the same credential and endpoint infrastructure backs both, so current .bazelrc configuration carries over. For C++ and Rust codebases where 32 vCPUs still isn't enough parallelism, remote execution is the natural next step.
Migration Checklist
A reference for teams moving from GitHub-hosted runners with GCS/S3 remote cache to Namespace. Decision points only, not a tutorial repeat.
| Step | Action | Notes |
|---|---|---|
| 1. Profile creation | Create a Namespace runner profile with Bazel add-on enabled | One profile per distinct shape requirement |
| 2. Workflow update | Change runs-on to the new profile name | Single-line change per workflow file |
3. .bazelrc cleanup | Remove --remote_cache, --google_credentials, and any GCS/S3 auth flags | Namespace generates its own credentials at runtime |
4. .bazelrc additions | Add --remote_upload_local_results=true, --remote_timeout=60, --jobs=HOST_CPUS*2, --experimental_remote_cache_compression=true | See configuration section above |
| 5. Cache volume sizing | Set volume size based on codebase type and estimated output footprint | Start larger than you think you need |
| 6. Local dev setup | Run nsc cache bazel setup locally to enable local-to-CI cache sharing | Requires Namespace CLI installed and authenticated |
| 7. Validate first run | Check Bazel's process summary for cache hit counts and check Usage Explorer for cache read events | First run after migration will be cold; second run confirms cache is working |
| 8. Credential cleanup | Revoke long-lived GCS/S3 service account keys used for the old remote cache | Namespace uses short-lived tokens; no long-lived keys needed |
A successful first cached run shows remote cache hit accounting for the majority of processes in Bazel's output summary, cache read events appearing in the Namespace Usage Explorer, and wall-clock time dropping relative to the cold run.
Conclusion
Bazel's caching model requires two layers to work well: a fast local disk cache that absorbs the bulk of cache hits at sub-millisecond latency, and a remote cache that shares build results across machines and across runs. Ephemeral GitHub-hosted runners break the local cache layer by design, forcing every run onto the remote cache alone, where latency accumulates across hundreds of action key lookups. actions/cache workarounds help but don't close the gap fully. Namespace solves the problem at the infrastructure layer with persistent NVMe-backed Cache Volumes that survive job teardown, a co-located hot cache tier that cuts remote cache lookup latency to near-disk speeds, and a workspace-scoped credential model that enables local builds to share the same cache backend CI uses.
Setup is a one-line runs-on change plus four .bazelrc flags. For teams spending engineering hours on slow Bazel CI and wondering why the cache isn't doing more, the answer is almost never in the .bazelrc. It's in the runner.
Frequently Asked Questions
1. Does Namespace's Bazel cache work with bazel-contrib/setup-bazel?
Yes. Namespace writes its configuration to /etc/bazel.bazelrc at the system level, while setup-bazel writes to the user bazelrc. Bazel merges both in order, so remote cache credentials from Namespace coexist with Bazelisk version pinning from setup-bazel without conflict.
2. Can multiple repositories share the same Namespace Bazel cache?
They can share a Cache Volume tag, but it's usually counterproductive for Bazel. Action keys include toolchain hashes, so separate volumes per repository is the safer default.
3. What happens if a CI job fails partway through?
Namespace Cache Volumes only commit when a job exits with code 0. Failed jobs have their cache changes discarded automatically, leaving the volume in its pre-job state.
4. Is the Bazel cache content encrypted at rest?
Namespace's artifact storage backs the cold tier of the Bazel cache. See the security documentation for data-at-rest protections and the workspace access documentation for RBAC controls.
5. How do short-lived credentials work for local development?
Running nsc cache bazel setup locally generates credentials that expire after a few hours. The CLI handles renewal automatically, so developers don't manage rotation manually. Long-lived GCS or S3 service account keys are not required and should be revoked once the migration is complete.